
Insights and dashboards fundamentally changes the way businesses interact with operational data. Instead of manually building reports or exporting spreadsheets, simply ask for the information you need. Insights will allow you to generate interactive reports within seconds and refine your data into graphs, charts or other desired displays. Once you're happy with your insights, you will have the ability to create multiple custom dashboards, allowing you efficiently illustrate and utilise your business intelligence. Continue reading this article to see how to create your AI driven insights and how to compose your custom dashboards.
Creating your Insights
1. Navigate to https://app.allotrac.io/ and log in to your Allotrac.io site.
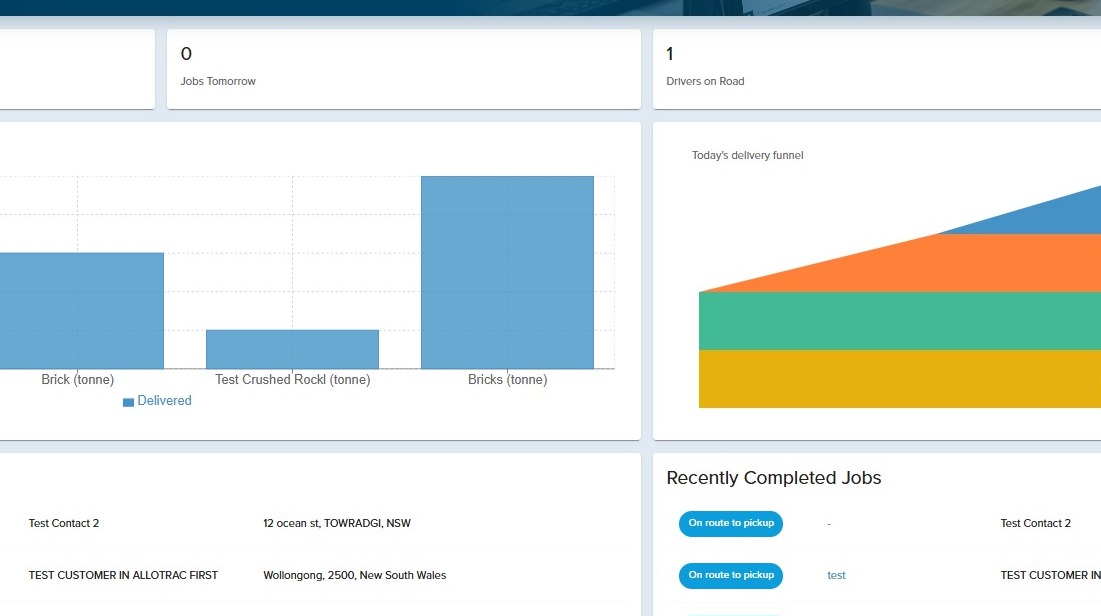
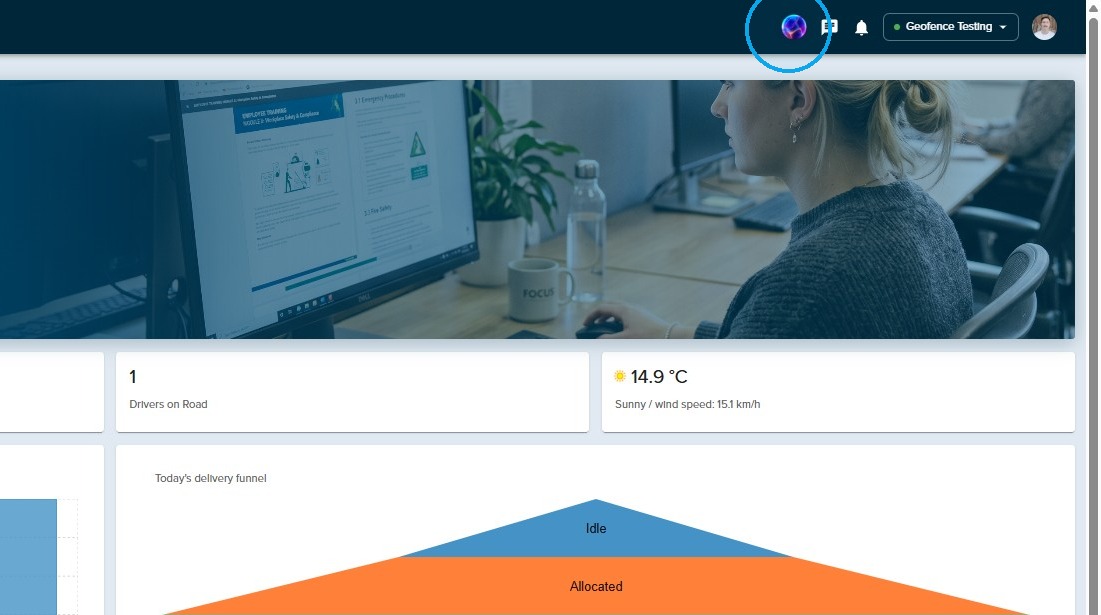
2. To create your insights, simply click on the "Allie" AI assistant icon located in the top right hand corner of your screen.
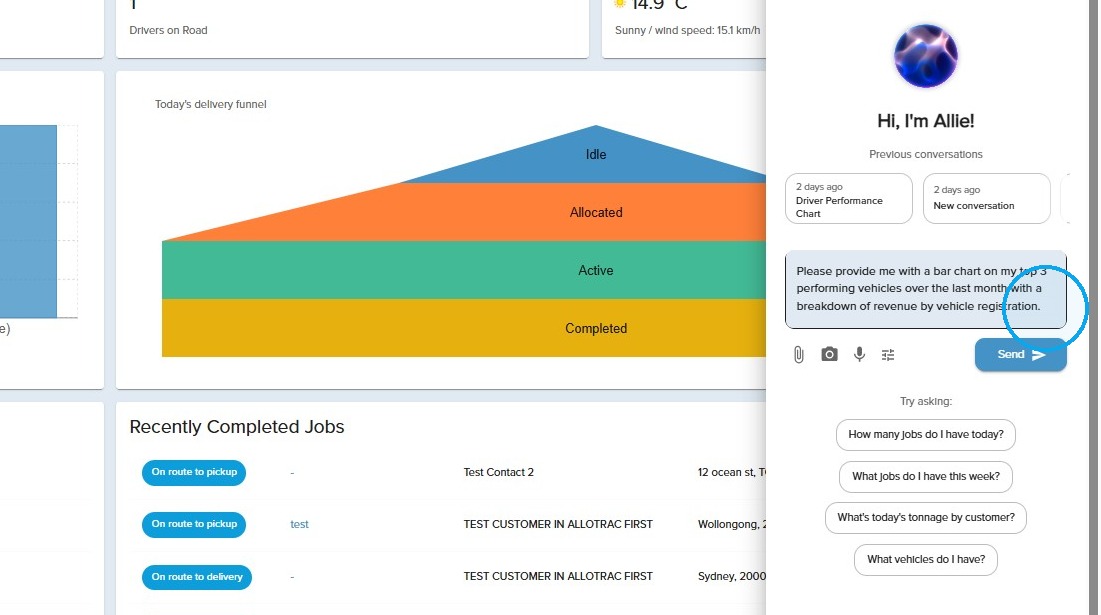
3. Type in the custom report that you would like Allie to compose for you.
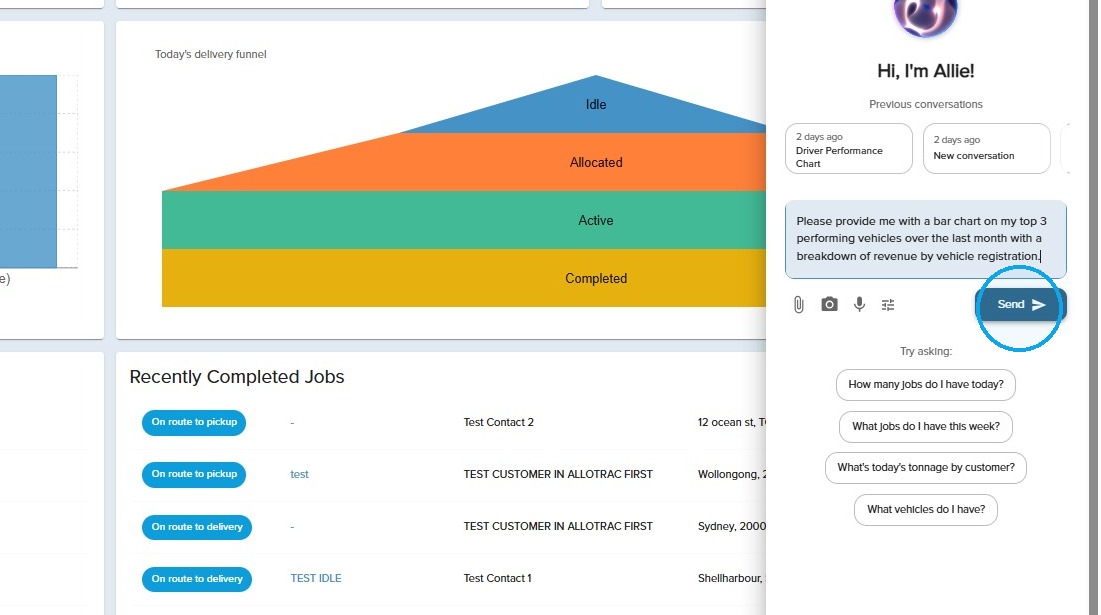
4. Once you have detailed your desired data and the desired format in which you need it, click the "Send" button as shown below.
5. Allie will then generate your custom insight for you. Please note that if the data is not exactly what you're looking for, you have the ability to reply back and ask for corrections where needed.
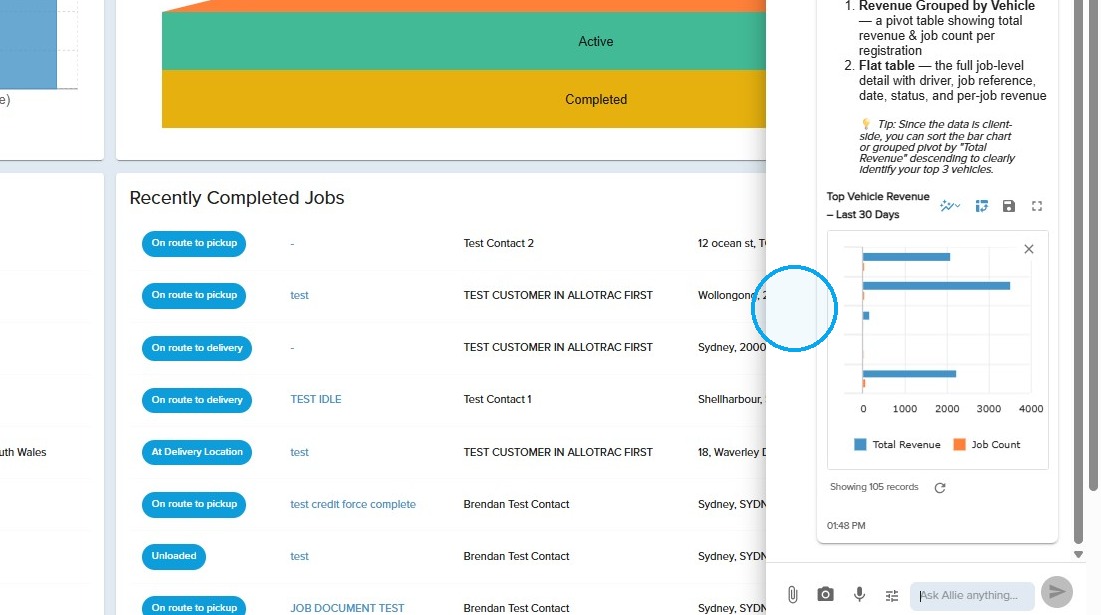
6. To view the insight in more detail, click the "Open Fullscreen" button located at the top of the insight.
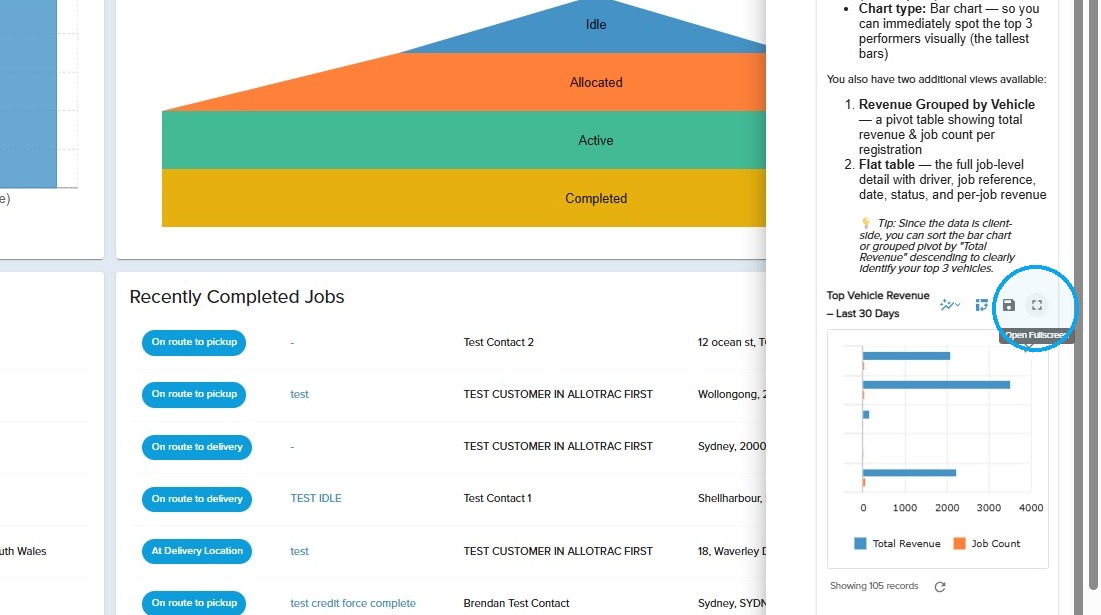
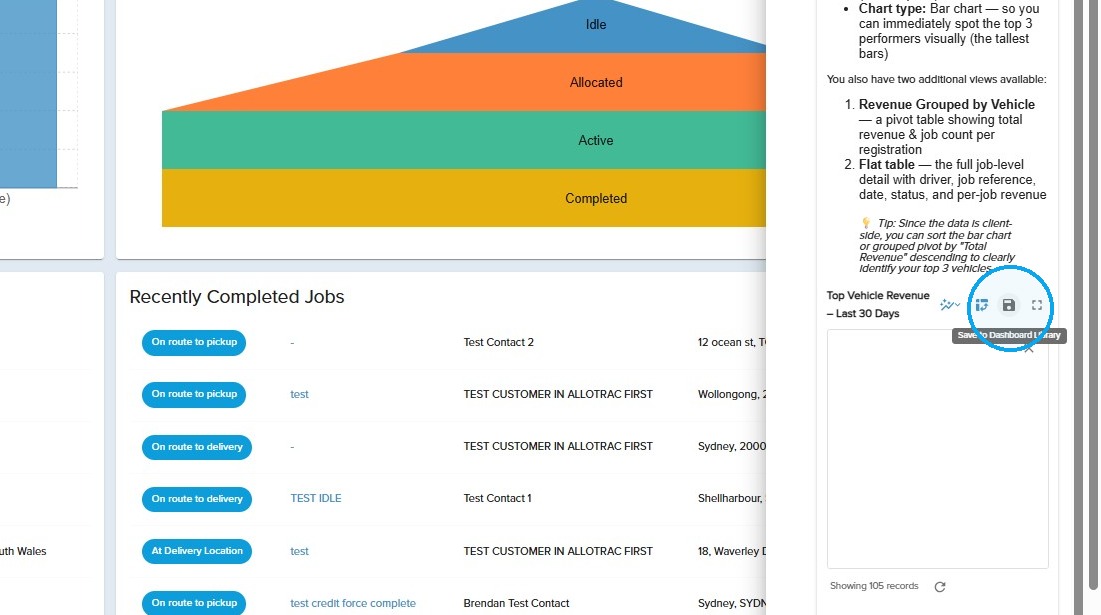
7. Once you're satisfied with the insight you have been provided with, click the "Save to Dashboard Library" button as shown below.
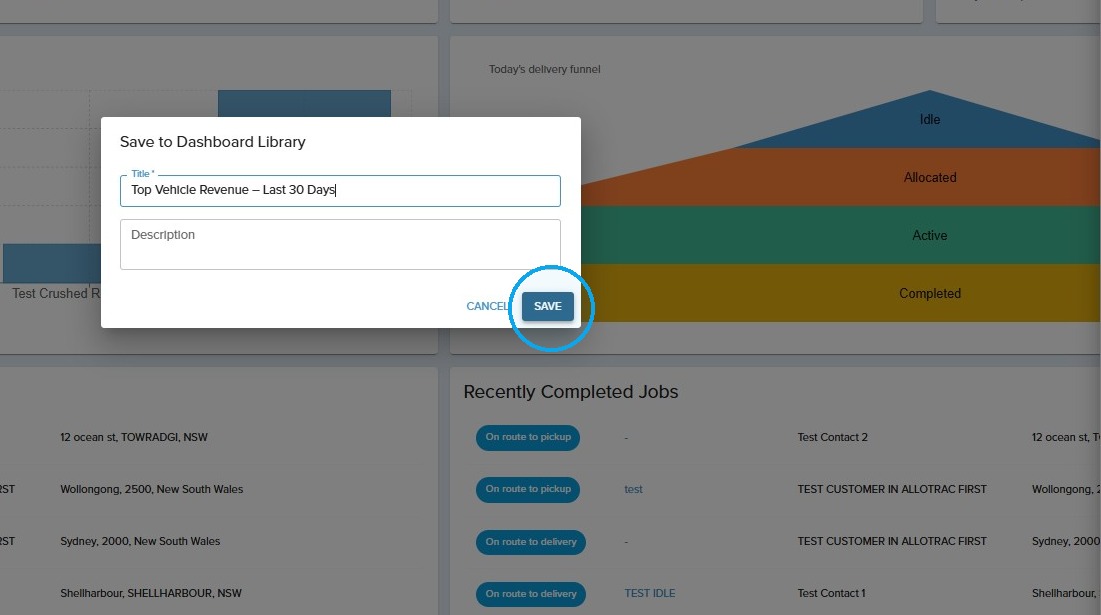
8. Assign a "Title" and "Description" to your insight. Then click "SAVE" to create and save your insight.
Creating your Dashboard
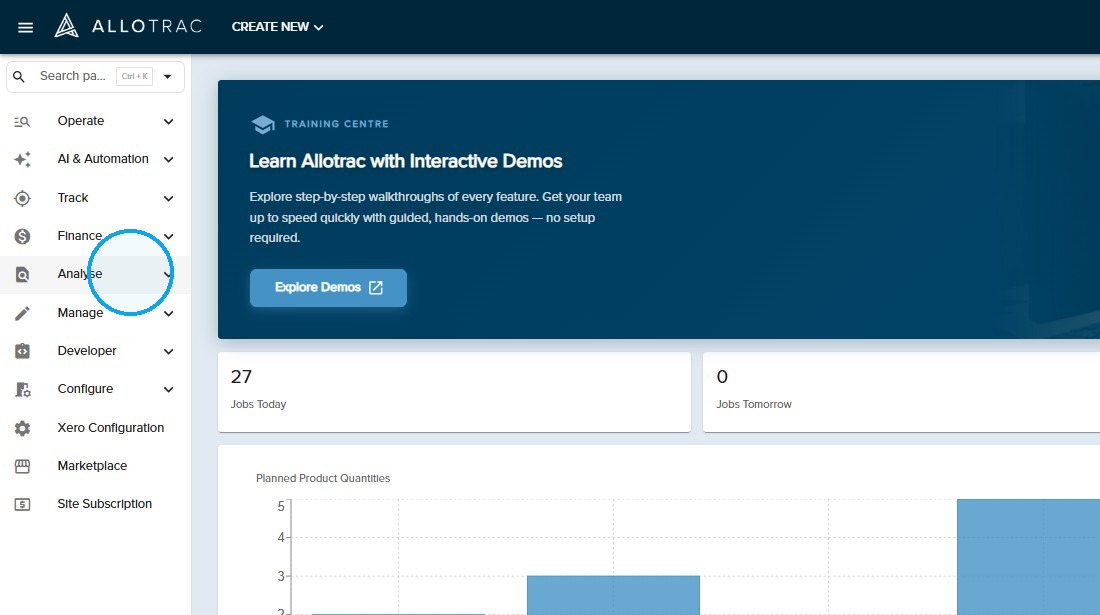
1. To set up your dashboard, click the "Analyse" tab from the side menu
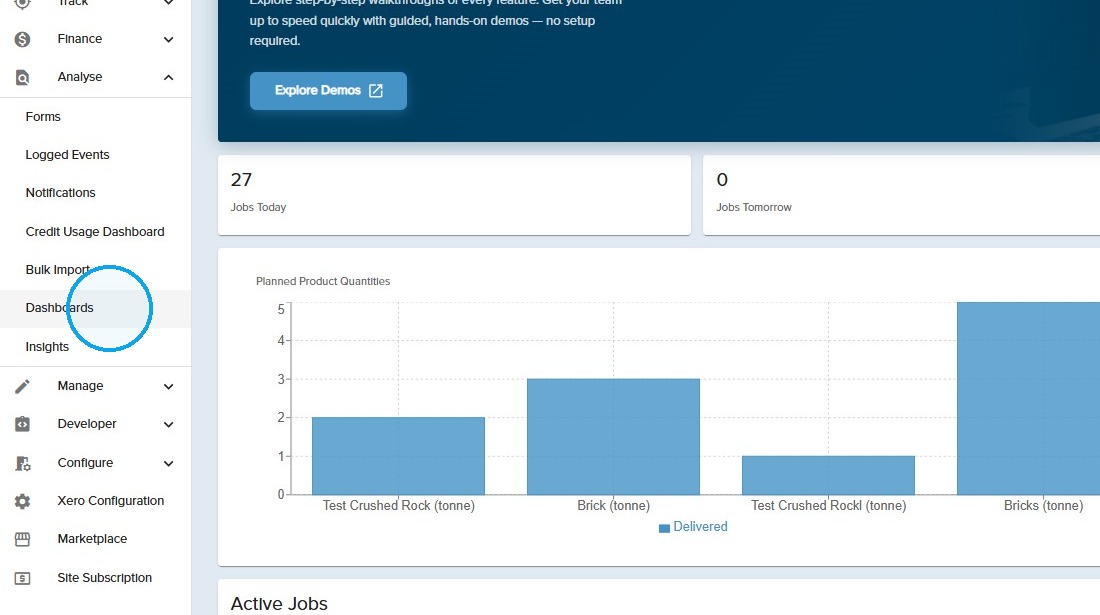
2. Click the "Dashboards" button from the drop down menu.
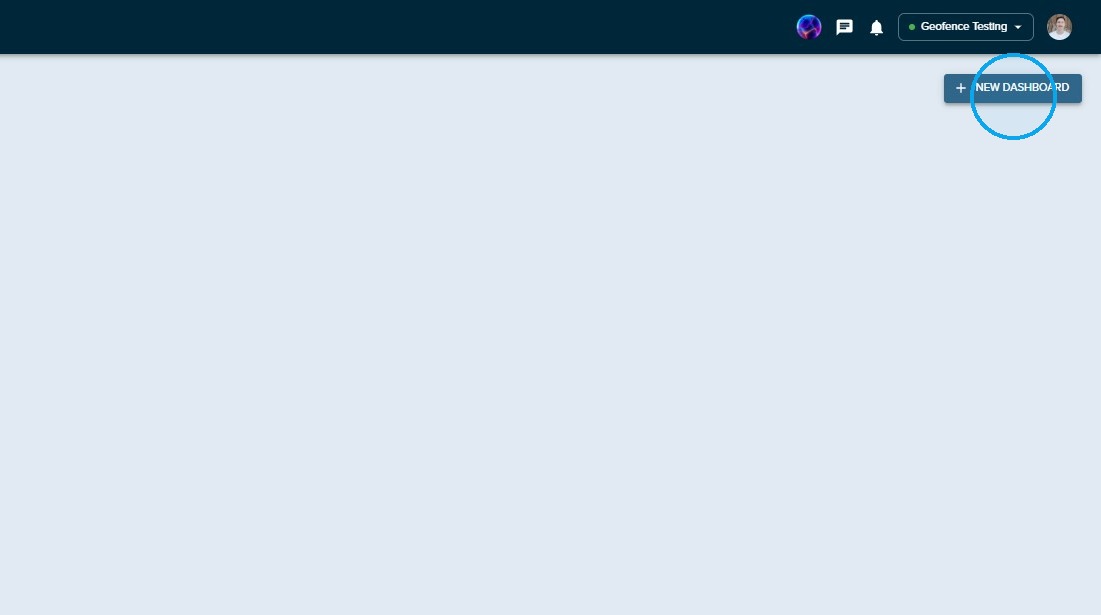
3. Click the "New Dashboard" button in the top right hand corner of your screen.
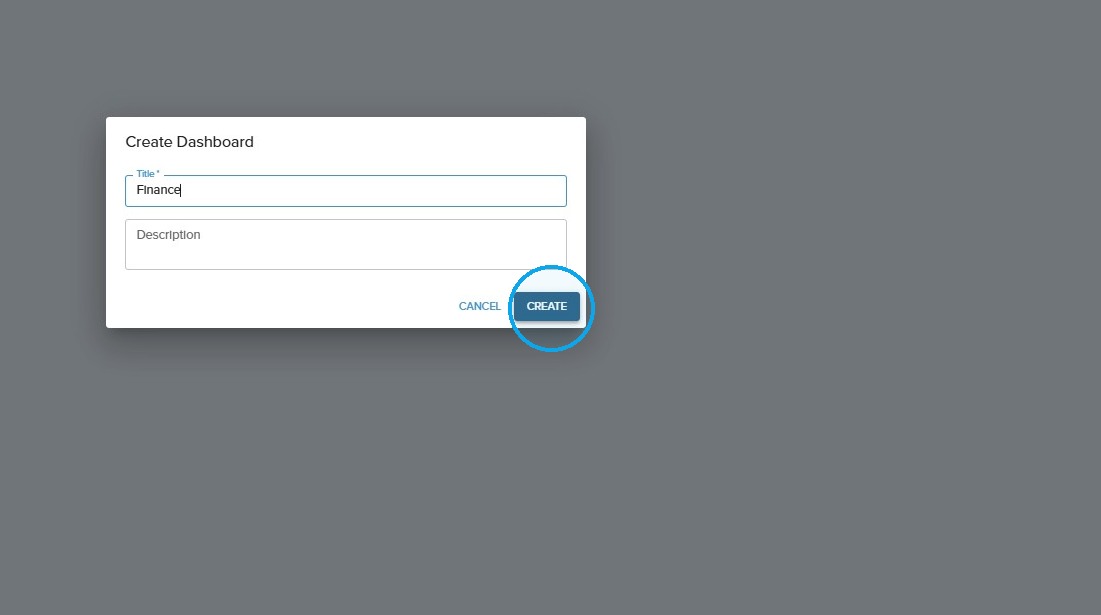
4. Assign a title and description for your dashboard and click the "Create" button.
Adding Insights to your Dashboard
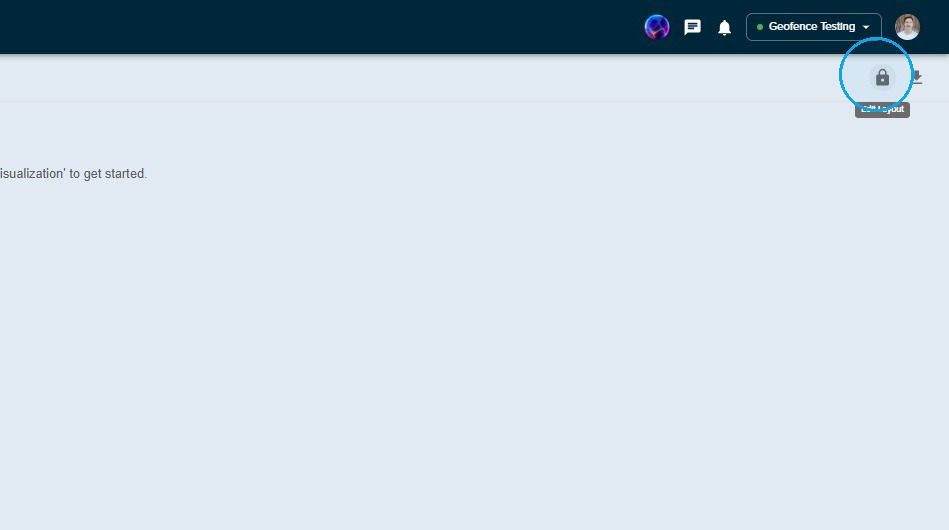
1. Click the "Edit Layout" button in the top right hand corner of the screen.
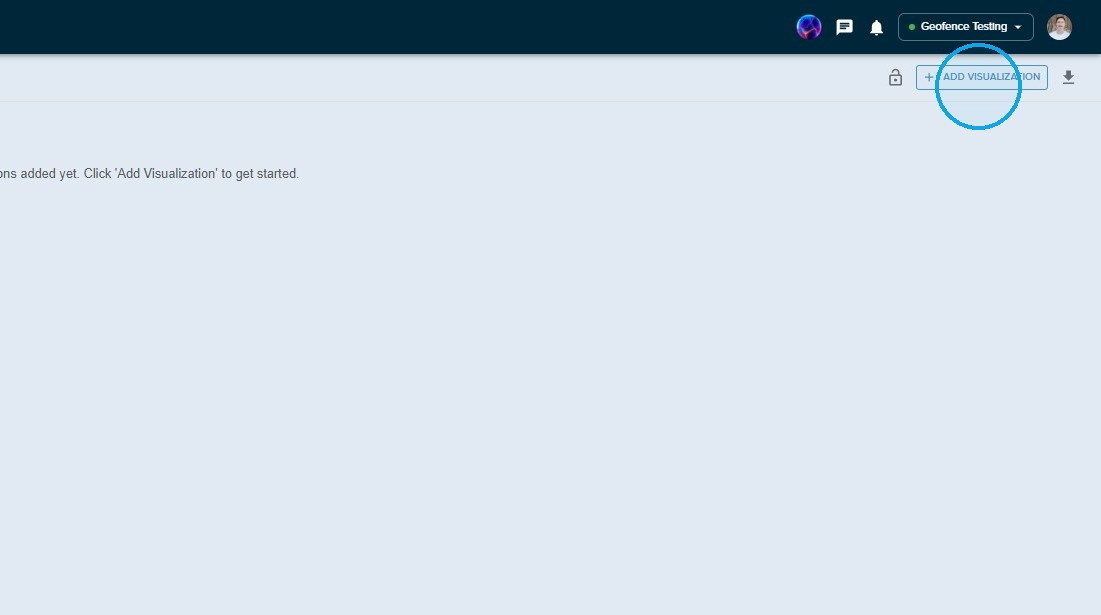
2. Click the "Add Visualisation" button as shown below.
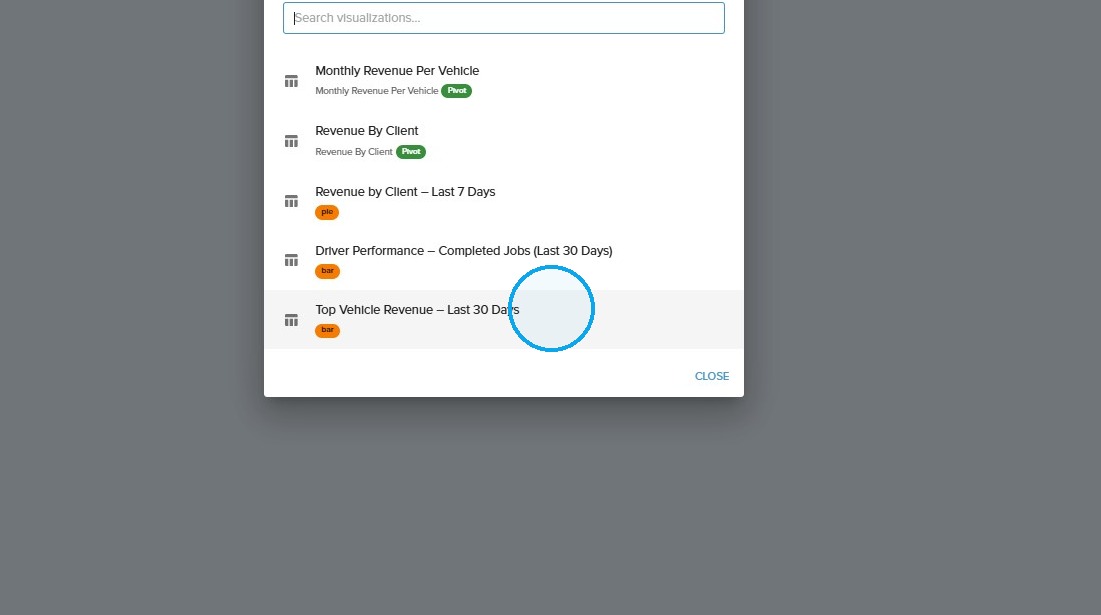
3. Select the insight that you would like to add to this new dashboard.
You can have multiple insights within one dashboard. To add more afterwards, continue adding insights through your AI assistant "Allie" and the process shown above.
4. Click and drag your insights around the screen to suit your preferences.
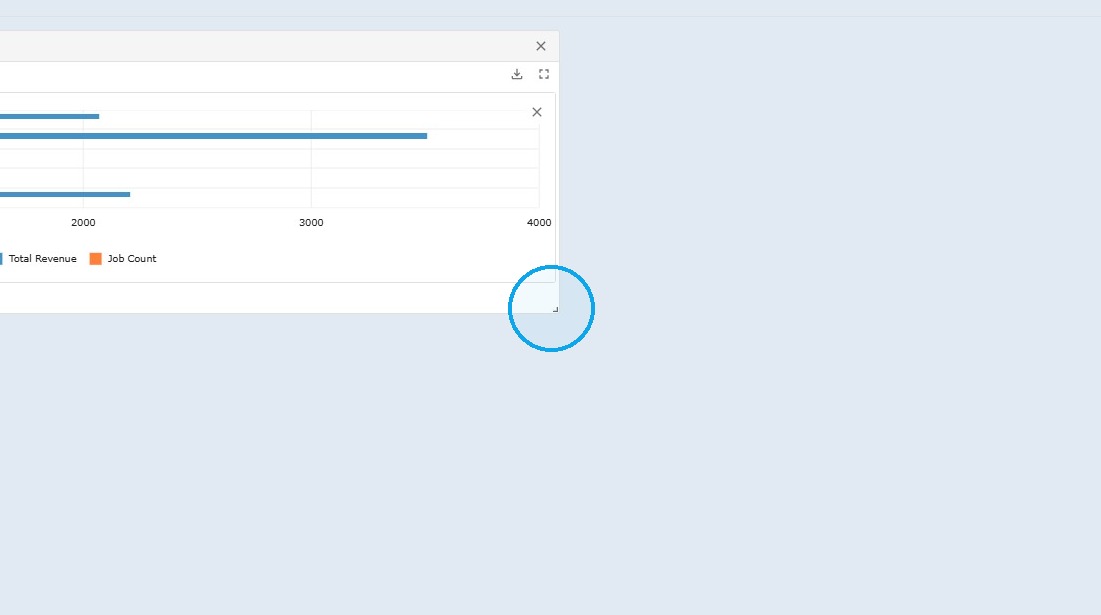
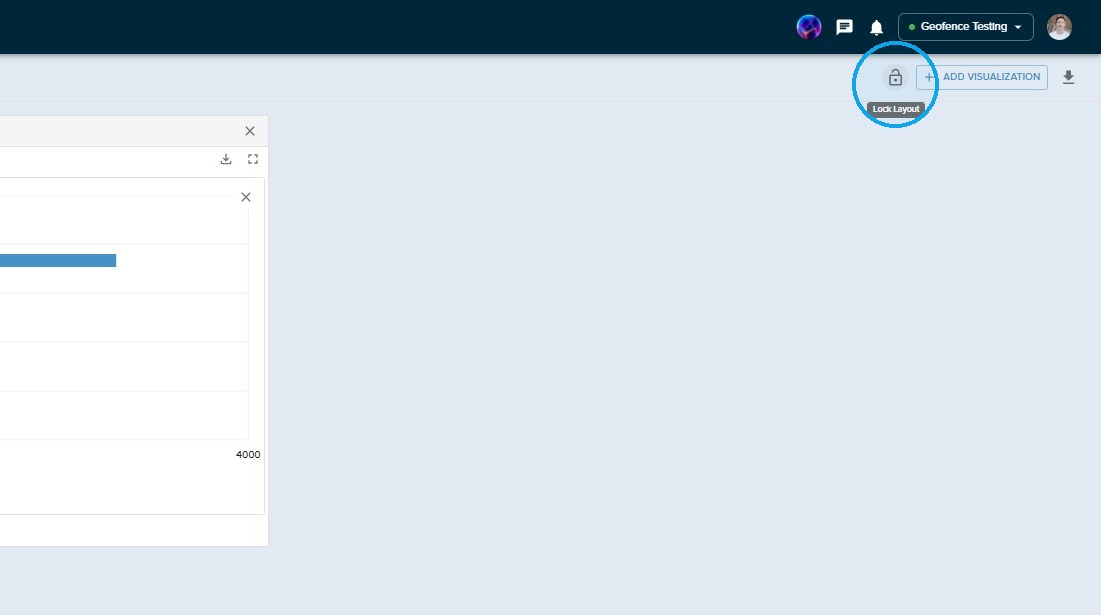
5. When you're happy with the configuration of your dashboard, click the "Lock Layout" icon as shown below.
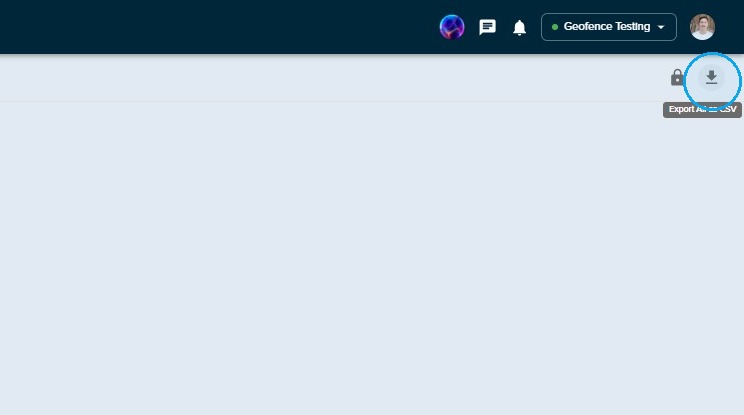
6. If you ever need to export this data, click the "Export All as CSV" button as shown below to export all of your insights within this dashboard as CSV files.
You now know how to create your insights and create your custom insight dashboards, storing and accessing your business intelligence within a single place!